Distance Matrix
07/2022 - 08/2022
Tech Stack:
Description: Predict travel time using H3, Distance Matrix, and NetworkX Dijkstra
Introduction
Every time if you want to go to an unfamiliar or distant location, you would always certainly want to use some sort of navigation system (Google Maps, Apple Maps, etc) to guide you to the destination. The map system would return you a route that would avoid potential traffic and buildings. In our model, we are able to simulate a similar route system with linear route.
Our steps of approaching
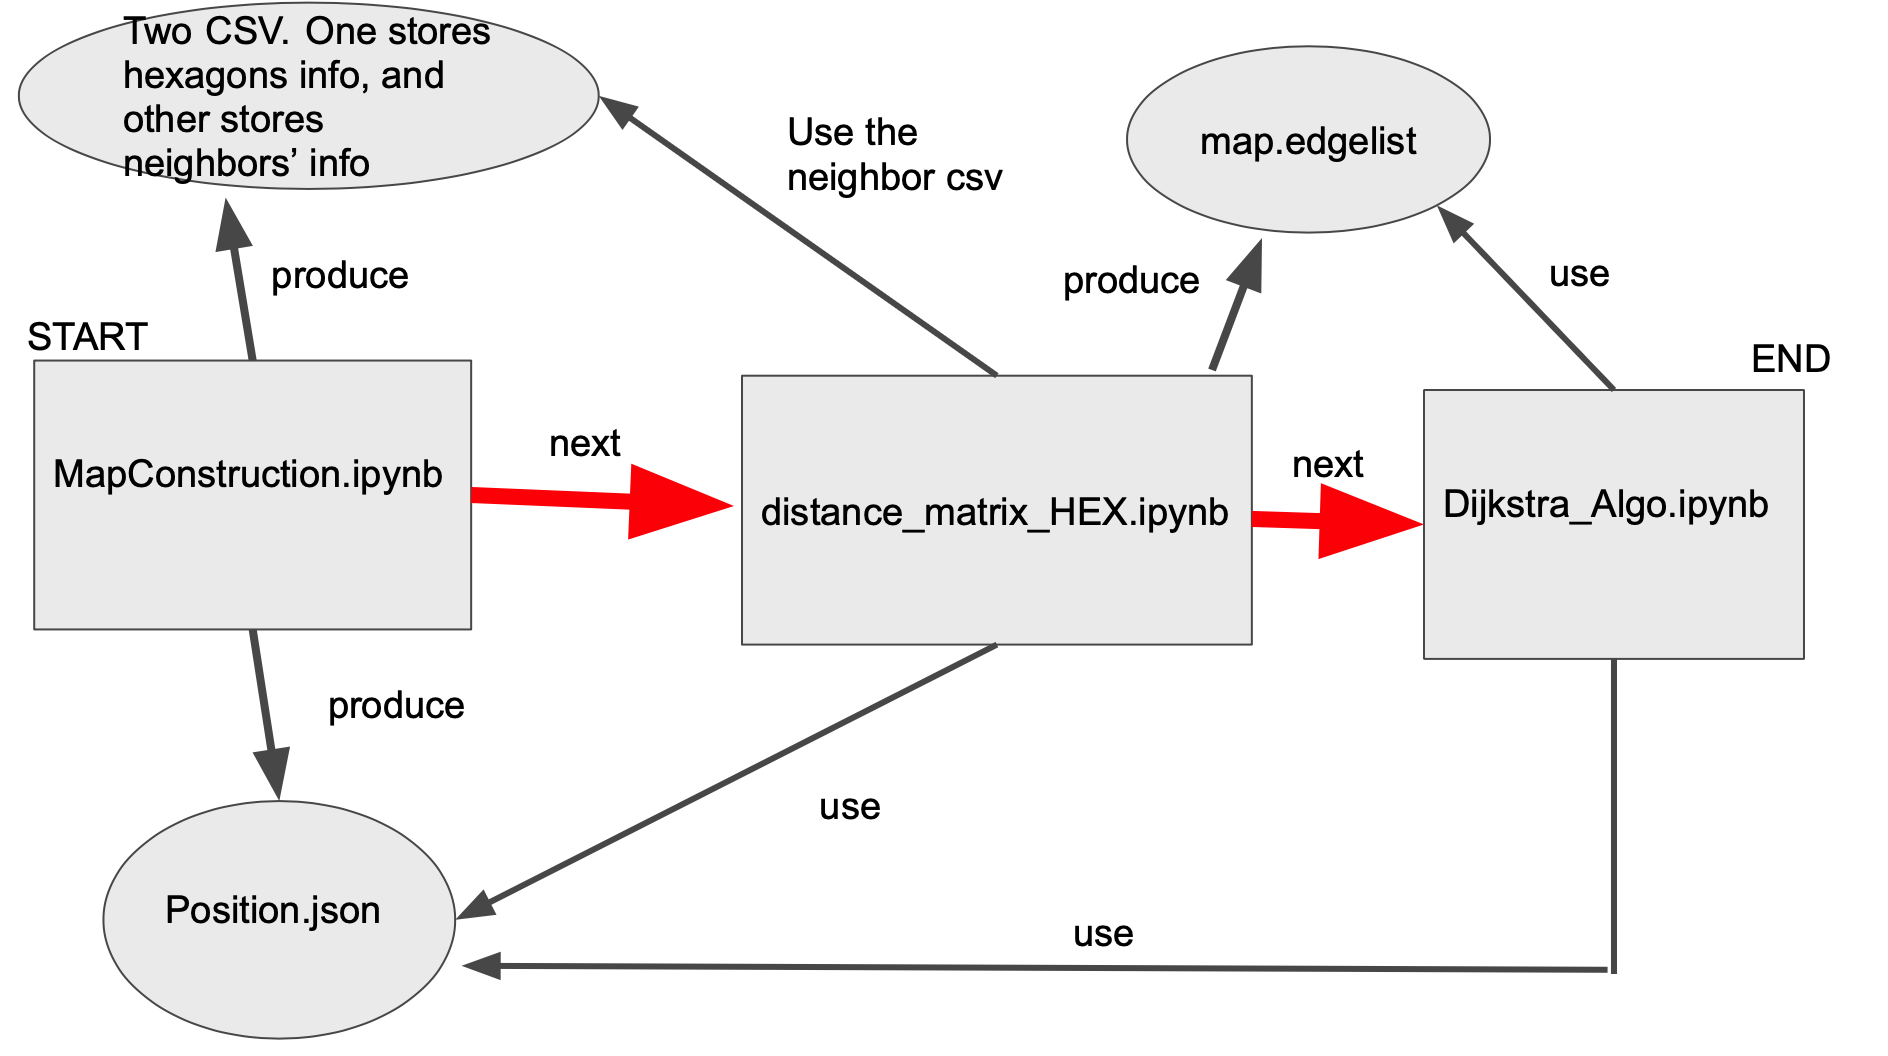
MapConstruction.ipynb
- Obtain the geographical data from a specified county (we choose Suffolk county in Massachusetts, but you can choose any county you want in the U.S.A.)
- Visualize the county
- Divide the county by hexagons and store the hexagon information in a csv
- h3_id (the id that uniquely identifies the hexagon)
- h3_geo_boundary (the data about the hexagonal boundary)
- h3_centroid (latitude and longitude of the center of the hexagon)
- Find the 1st degree neighbors of each hexagon and store their neighbors in another csv
- Find the center of each hexagon and store their coordinates (lat,lon) in the "position.json" file
Distance_matrix_HEX.ipynb
- Construct request link with the coordinate of one origin and one nearby neighbor to call the API
- The number of times we call the API is the number of edges of the graph
- In other words, the run time complexity is O(e) where e is the number of edges of the graph
- Obtain API response data from the API in JSON format
- However, we only need duration in traffic, which is the length of time it takes to travel on this linear route, based on current and historical traffic conditions
- Utilize a graph library called Networkx to add edges (u,v) and edges attributes (weight) to the graph
- Store the edges information in a file called "map.edgelist" file to prevent the API data is lost (also a way of preventing calling the API again and again)
- The Google Map Distance Matrix is a bit costly. You can check the price here.
- Construct request link with the coordinate of one origin and one nearby neighbor to call the API
Dijkstra_Algo.ipynb
- It allows us to find the shortest path between two nodes of a graph
- In our case, it is finding the most time efficient path between two delivery orders
Walkthrough with "Entity-Relation" Diagram

Librarys
As with everything done in Python, you would always need to import libraries. Here is a list of libraries I use for this project:
- h3: to work with hexagons
- h3.k_ring(h3_id, 1) -> finds the 1st degree neighbor given h3 id
- h3.polyfill_geojson(poly_geojson, resolution) -> fills out the hexagon
- h3.h3_to_geo(h3_hex) -> converts the h3 id to geographical coordinates (lat, long)
- h3.geo_to_h3(lat, long, resolution) -> convert a given coordinate and its resolution to a h3 id
- networkx: to connect edges and draw the graph
- json: to store geographical coordinates of center of each hexagon
- geopandas: to retrieve infomation from the geopackage (in our case, it is gpkg file)
- pandas: to work with csv
- shapely: to construct polygons
- matplotlib.pyplot: to make beautiful visualization
- csv: to read and write the neighbors data
- requests: to construct API connection
Remember to install the package with the following command:
pip install <the name of the package>
Dijkstra's algorithm
I have included an example of code snippet to show how this algorithm works in "experiment.ipynb".

This a graph with 5 nodes and 7 edges. What is the best way to go from 2 to 5?
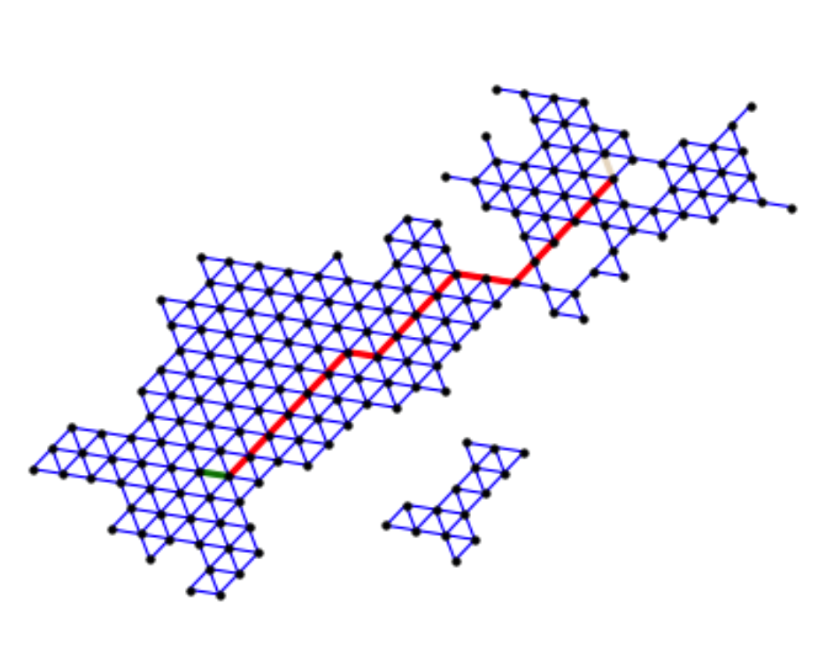
An example of a path for two delivery points
This is a path from Roslindale to South Boston waterfront, and it takes 49 minutes to travel.

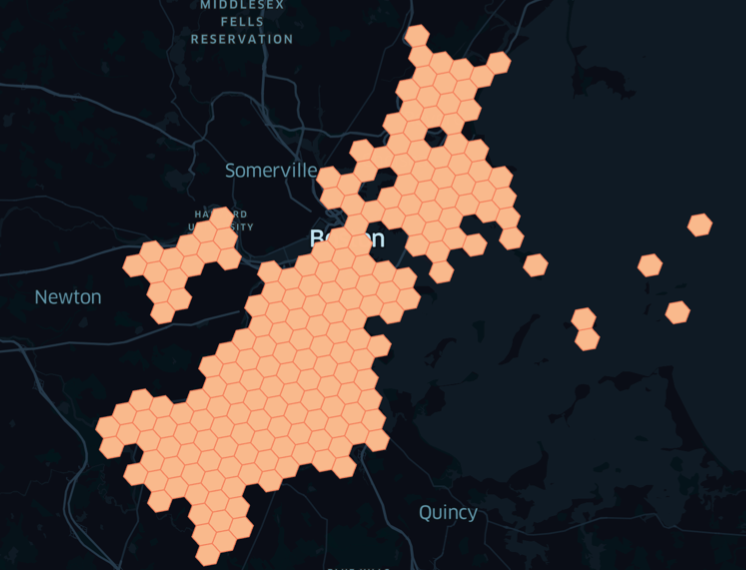
What it looks like on Uber's Kepler's gl website
- Kepler'gl is a very powerful web application for geospatial analytic visualizations.
- When you open the website, go to "get started" and drag the csv from the CSVFolder that does not contain the postfix "neighbor".
